.svg&w=384&q=75 "Pitchgist logo")
Burnley and Wolves End Season with 1-1 Draw at Turf Moor
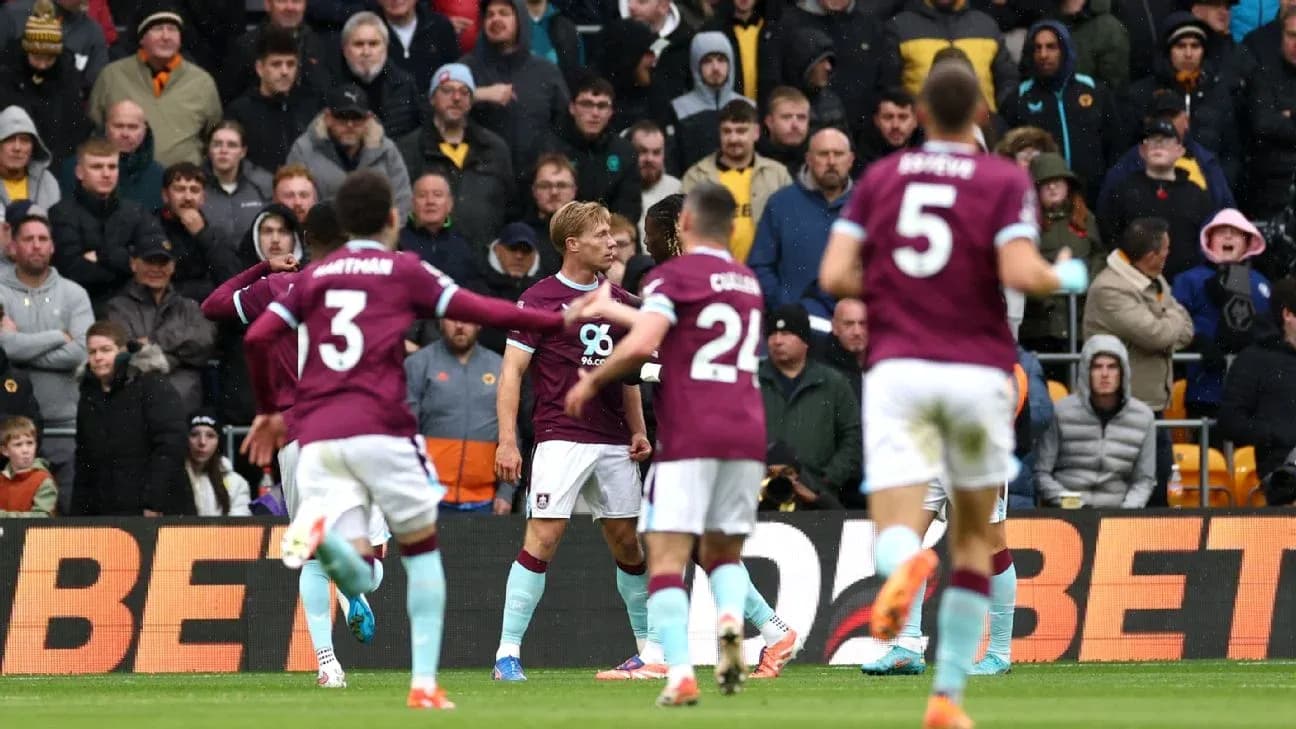
On the final afternoon at Turf Moor, Burnley and Wolves shared a 1-1 draw that felt less like a dead rubber between two relegated sides and more like a mirror held up to two broken seasons. Following this result, Burnley finished 19th on 22 points with a goal difference of -37, while Wolves closed the campaign 20th on 20 points and a goal difference of -41. Between them, they had managed just 7 wins in total this Premier League season; the draw was an apt closing chapter.
I. The Big Picture – Shapes, scars and seasonal DNA
Burnley went to their most trusted structure, a 4-2-3-1 that has been their default this campaign, used 13 times in total. Mike Jackson’s selection spoke to a desire for control rather than chaos: M. Weiss in goal behind a back four of K. Walker, A. Tuanzebe, B. Humphreys and Lucas Pires; a double pivot of Florentino and L. Ugochukwu; then an attacking line of L. Tchaouna, H. Mejbri and J. Anthony supporting Z. Flemming as the nominal striker.
This shape tried to reconcile two conflicting truths of Burnley’s season. Overall they scored 38 goals in 38 league games, exactly 1.0 goals per match, but they conceded 75, an overall average of 2.0 goals against. At home they were slightly more secure, allowing 29 goals in 19 matches (1.5 per game) and scoring 18 (0.9 per game). The 1-1 here was almost an exact expression of that narrow attacking output and chronic defensive exposure.
Wolves, already consigned to the drop, leaned into their season-long identity: a back three in a 3-4-2-1, the formation they have used 12 times in total. Rob Edwards built from J. Sa in goal, with Y. Mosquera, S. Bueno and L. Krejci as the defensive trio. The wing-and-engine band of R. Gomes, Andre, A. Gomes and D. M. Wolfe underpinned a front three of M. Mane, Hwang Hee-Chan and A. Armstrong.
Their structure masked a stark attacking problem. Overall they scored only 27 goals in 38 games, an average of 0.7 per match. On their travels they were even more blunt: 8 away goals in 19 games, just 0.4 per match, while conceding 34 away (1.8 per game). To emerge from Turf Moor with a goal and a point was, by their own standards this year, a relatively productive away day.
II. Tactical Voids – Absences and discipline
Both managers arrived with key absences that subtly rewired their squads. Burnley were without J. Beyer (hamstring) and J. Cullen (knee), removing a natural centre-back option and a metronomic midfield link. Without Cullen, the double pivot leaned more on Florentino’s screening and L. Ugochukwu’s energy, but less on a true passing hub from deep.
Wolves’ list was longer: L. Chiwome, M. Doherty, E. Gonzalez and S. Johnstone all missed out. The absence of Doherty, in particular, limited the ability to flip from a back three into a more aggressive back four in possession, keeping Wolves’ wing structure more conservative and placing extra physical and tactical load on R. Gomes and D. M. Wolfe.
Across the season, both sides carried a disciplinary edge. Burnley’s yellow-card timings reveal a team that tends to heat up as games wear on. Their bookings peaked between 16-30 minutes (19.70%) and again in the final quarter-hour of regulation (18.18%), with another late spike between 91-105 minutes (19.70%). Red cards were spread across 31-45, 76-90 and 91-105 minutes, each accounting for 33.33% of their total. This pattern underlines a side that often tackled desperation rather than game state.
Wolves’ yellows clustered differently: their most volatile window was 46-60 minutes, with 27.50% of their bookings, followed by 61-75 (20.00%) and 76-90 (18.75%). Their reds were evenly split across 31-45, 46-60 and 61-75 minutes, each at 33.33%. That rhythm suggests a team that frequently lost control in the heart of the match, just as tactical adjustments and fatigue start to bite.
III. Key Matchups – Hunter vs Shield, Engine Room battles
The clearest “Hunter vs Shield” duel featured Z. Flemming against a Wolves defence that has bled all year. Flemming’s league return of 11 goals overall from midfield, backed by 38 shots (21 on target), marked him out as Burnley’s primary finisher. He arrived here as their top scorer and emotional reference point.
He was up against a Wolves back line that, in total, conceded 68 goals, with 34 of those on their travels. The away average of 1.8 goals against per match reflects a unit that often buckled under sustained pressure. Yet within that, Y. Mosquera has been a defiant presence. Over the season he blocked 17 shots and won 160 of 280 duels, an aggressive front-foot defender whose willingness to step out can both suffocate and expose his side.
In the “Engine Room” zone, the confrontation between Burnley’s creative fulcrum and Wolves’ enforcers defined the game’s texture. H. Mejbri, who finished the season with 1 goal and 4 assists, brought 21 key passes and 34 dribble attempts (20 successful). His role in the No. 10 slot was to find pockets behind Andre and A. Gomes, receiving between the lines and threading runners like Tchaouna and Anthony.
Andre, one of Wolves’ yellow-card leaders with 12 bookings, embodied the enforcer role. Across the campaign he made 82 tackles and 13 successful blocks, while committing 47 fouls. His remit here was clear: disrupt Mejbri’s rhythm, even at the risk of a card. Behind him, Mosquera’s own 62 tackles and those 17 blocked shots meant Burnley’s attempts to play through Flemming’s feet or attack crosses had to navigate a physically dominant shield.
IV. Statistical Prognosis – xG shadows and defensive frailty
We do not have explicit xG values, but the season-long numbers sketch the expected profile of this match. Heading into this game, Burnley’s overall average of 1.0 goals scored and 2.0 conceded, combined with Wolves’ 0.7 scored and 1.8 conceded, pointed towards a low-scoring encounter tilted slightly towards the home side. Burnley’s home attack at 0.9 goals per game versus Wolves’ away attack at 0.4 suggested that any xG model would lean Burnley’s way in terms of chance volume, but not by a huge margin.
Defensively, neither side offered a platform of solidity. Burnley’s 75 goals conceded overall and Wolves’ 68 created an environment where almost any attack could find encouragement. Wolves’ 19 failed-to-score matches overall, including 12 away, hinted that their actual finishing often lagged behind whatever xG they did generate. For Burnley, 14 games without scoring overall reflected similar inefficiency.
The 1-1 scoreline therefore reads like a statistical compromise: Burnley’s modest home attacking average met Wolves’ porous away defence; Wolves’ anaemic away attack met Burnley’s generous back line. If an xG model had been laid over Turf Moor’s grass, it would likely show Burnley edging the chance count but failing to convert superiority into victory, and Wolves nicking enough moments – perhaps through transition runs from Hwang Hee-Chan or Armstrong – to justify their goal.
In the end, this match was less about redemption and more about confirmation. Burnley’s 4-2-3-1, with Flemming as the hunter and Mejbri as the connector, showed why they were dangerous in flashes but too porous to survive. Wolves’ 3-4-2-1, anchored by Andre and Mosquera, underlined a side whose defensive warriors fought hard but were undermined by an attack that rarely rose above 0.7 goals per game overall. The draw sealed their fates, but the numbers had written this story long before the final whistle at Turf Moor.